|
PacketStorm Useful Function
|
|
|
| PacketStorm has various useful functions to emulate an
IP network that is close to the actual environment and to support user development, experiments, and
verification work. |
|
|
|
|
|
|
|
|
|
|
|
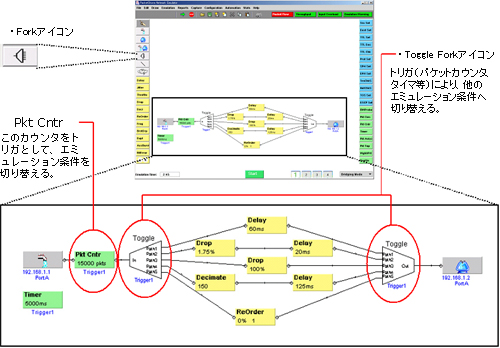
Fork icon
|
|
|
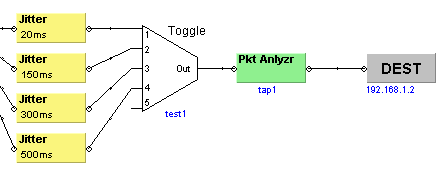
PacketStorm not only statically emulates the network set by the user, but also can dynamically change the network emulation condition by using the fork icon as a trigger condition such as a timer or the number of packets. is. This means that it is possible to emulate the Internet, where the network conditions greatly depend on the time of day.
The figure below is an example of changing the emulation conditions using the "Toggle Fork" function. In this example, the number of packets is used as the trigger to change the emulation condition, but time can also be used as the trigger.
|
|
|
|
|
|
|
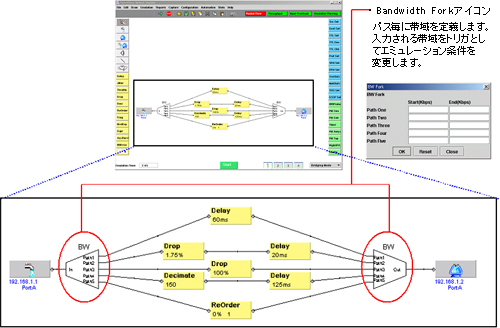
By using "Bandwidth Fork" as shown in the figure below, you can change the emulation conditions within the defined range of bandwidth.
|
|
|
|
|
|
Top of this page |
|
Close this window |
|
|
Furthermore, by using the ToS Fork / DiffServ Fork function, it is possible to set faults (Impairment) for each priority of the ToS field and DiffServ field. By using this function, it is possible to set a low delay for high priority packets and a high delay for low priority packets. By using this function, the QoS set by each carrier can be emulated.
|
|
|
|
|
|
Also, by using "Bandwidth Fork" as shown in the figure below, it is possible to change the emulation conditions depending on the input bandwidth.
|
|
|
|
|
|
|
|
|
|
|
|
|
|
Sub model
|
|
| Links that involve multiple complex obstacles can be stored in one cloud, saved, and loaded. By double-clicking the created cloud, you can change the parameters such as each obstacle at any time. |
|
|
|
|
|
|
|
|
|
|
|
|
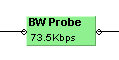
Bandwidth probe
|
|
| Shows the average throughput value and the amount of packets passed through at any point on the link.
|
|
|
|
|
|
|
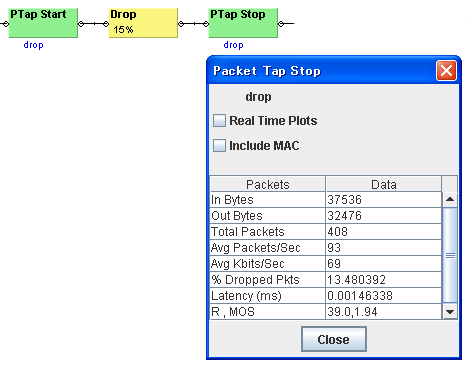
Packet tap
|
|
|
Shows statistics of packets passing between "PTap Start" and "PTap Stop" installed anywhere on the link. You can also plot and display these values on a graph in real time.
|
|
|
|
|
|
|
|
|
|
|
|
|
|
|
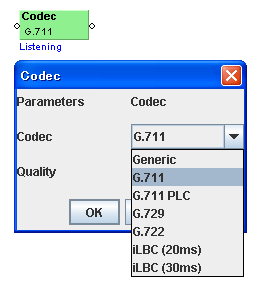
CODEC
|
|
|
You can select 7 types of CODEC type to display MOS value and R value. In addition, "Listening" (hearing quality) and "Conversational" (conversation quality) are available as quality evaluation options.
|
|
|
|
|
|
|
|
|
|
|
|
|
|
|
Link status display
|
|
| It displays the packet drop, delay, R value, and MOS value for each emulated link. You can also plot these values in a graph in real time.
|
|
|
|
|
|
|
|
|
|
|
|
|
|
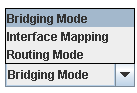
Packet transit mode
|
|
|
PacketStorm transfers a packet that passes between two interfaces in one of the following three modes.
1) Bridge mode: PacketStorm behaves like a bridg
2) Port mirror mode: Treat two interfaces as a simple transmission line and apply only faults.
3) Routing mode: Static routing is performed between two interfaces.
|
|
|
|
|
|
| |
|
Packet Tap
|
|
| In Bytes / In packets shows the amount of packets passing through the PTap Start icon, and Out Bytes / Out Packets shows the amount of packets passing through the PTap Stop icon. Also, the average packet amount per second between PTap Start / Ptap Stop, the drop rate, and the quality when delay and transit packets are assumed to be RTP packets are displayed. |
|
|
|
|
|
|
|
|
|
|
|
|
|
|
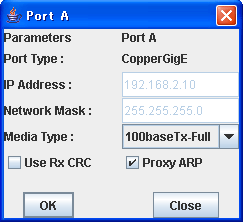
Proxy Arp
|
|
|
It can be set for each physical port installed in PacketStorm.
When Proxy Arp is enabled, the port will
respond to all incoming Arp requests.
|
|
|
|
|
|
|
|
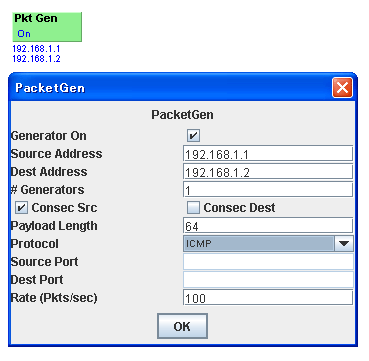
Packet generator(optional)
|
|
| Generate TCP, UDP or ICMP packets. In addition to specifying the source and destination IP addresses and port numbers, you can also set the packet length and packet rate (up to 100 packets/sec). |
|
|
|
|
|
|
|
|
|
|
|
|
|
|
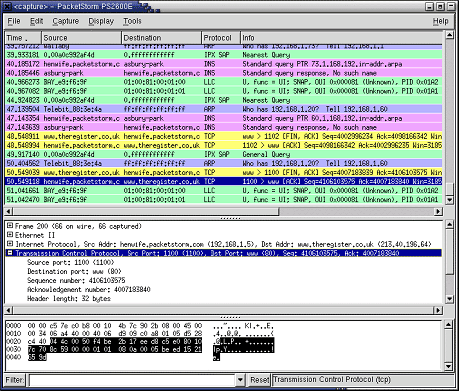
Packet analyzer(optional)
|
|
|
Packet analysis can be performed at any place on the link. Up to 4 analyzers can be installed.
|
|
|
|
|
|
|
|
|
|
|
|
|
|
|
|
|
| |
|
Packet recorder(optional)
|
|
| Packets can be captured and stored at up to 16 locations. This option requires the Packet Analyzer option above. |
|
|
|
|
|
|
|
|
|
|
|
|
|
Traffic conditioning(optional)
|
|
|
You can create a network queue by using the Wght/Prt icon.
Emulating queues include LBF, TBF, SFQ, FIFO, PFIFO, RED, WFQ, WRR and RR.
|
|
|
|
|
|
|
|
|
|
|
|
|
|
|
Capture and replay(optional)
|
|
|
Network Capture and Replay measures latency and packet loss between PacketStorm's management port and remote network devices. After the capture is complete, the delay and packet loss parameters are recorded in the Cloud icon. By using this icon, emulation that is close to the real environment is possible.
|
|
|
|
|
|
|
|
|
|
|
|
|
|
|
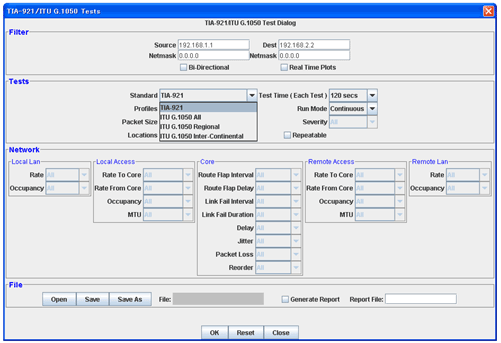
TIA-921 and ITU G.1050 (optional)
|
|
|
This option is an emulator option for performing multimedia performance verification on the network models specified by TIA-921 and ITU G.1050. By using this option, 1,064 test scenarios can be automatically executed. It can be used for verification of triple play compatible devices in various network environments.
|
|
|
|
|
|
|
|
|
|
|
|
|
|
|
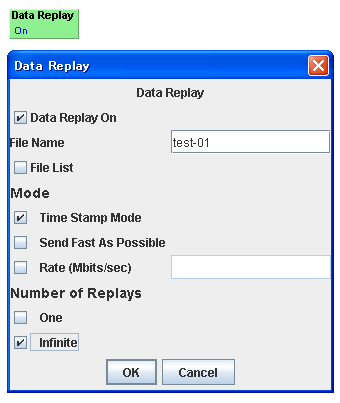
Data replay (optional)
|
|
|
Generate packets from data obtained with a packet analyzer or other compatible capture file. The captured data can be sent according to the time stamp, or "as soon as possible" or at the specified transmission rate.
|
|
|
|
|
|
|
|
|
|
|
|
|
|
|
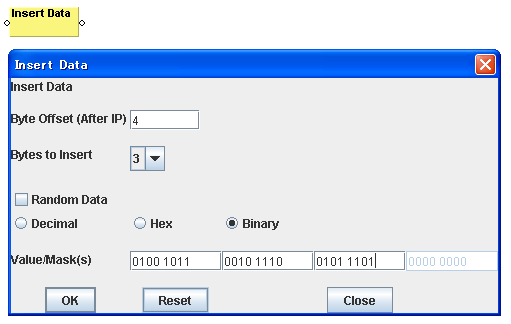
Data insertion(optional)
|
| |
| Insert 1 to 4 bytes of data at the offset position after the IP header |
|
|
|
|
|
|
|
|
|
|
|
|
|
|
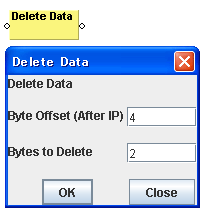
Data deletion(optional)
|
|
| Delete 1 to 4 bytes of data from the offset position after the IP header |
|
|
|
|
|
|
|
|
|
|
|
|
Ethernet jumbo packet(optional)
|
|
| Allows the Jumbo packet of up to 9,000 bytes to pass through the Gigabit Ethernet interface module to apply faults. |
|
|
|
| |
|
|
|
|